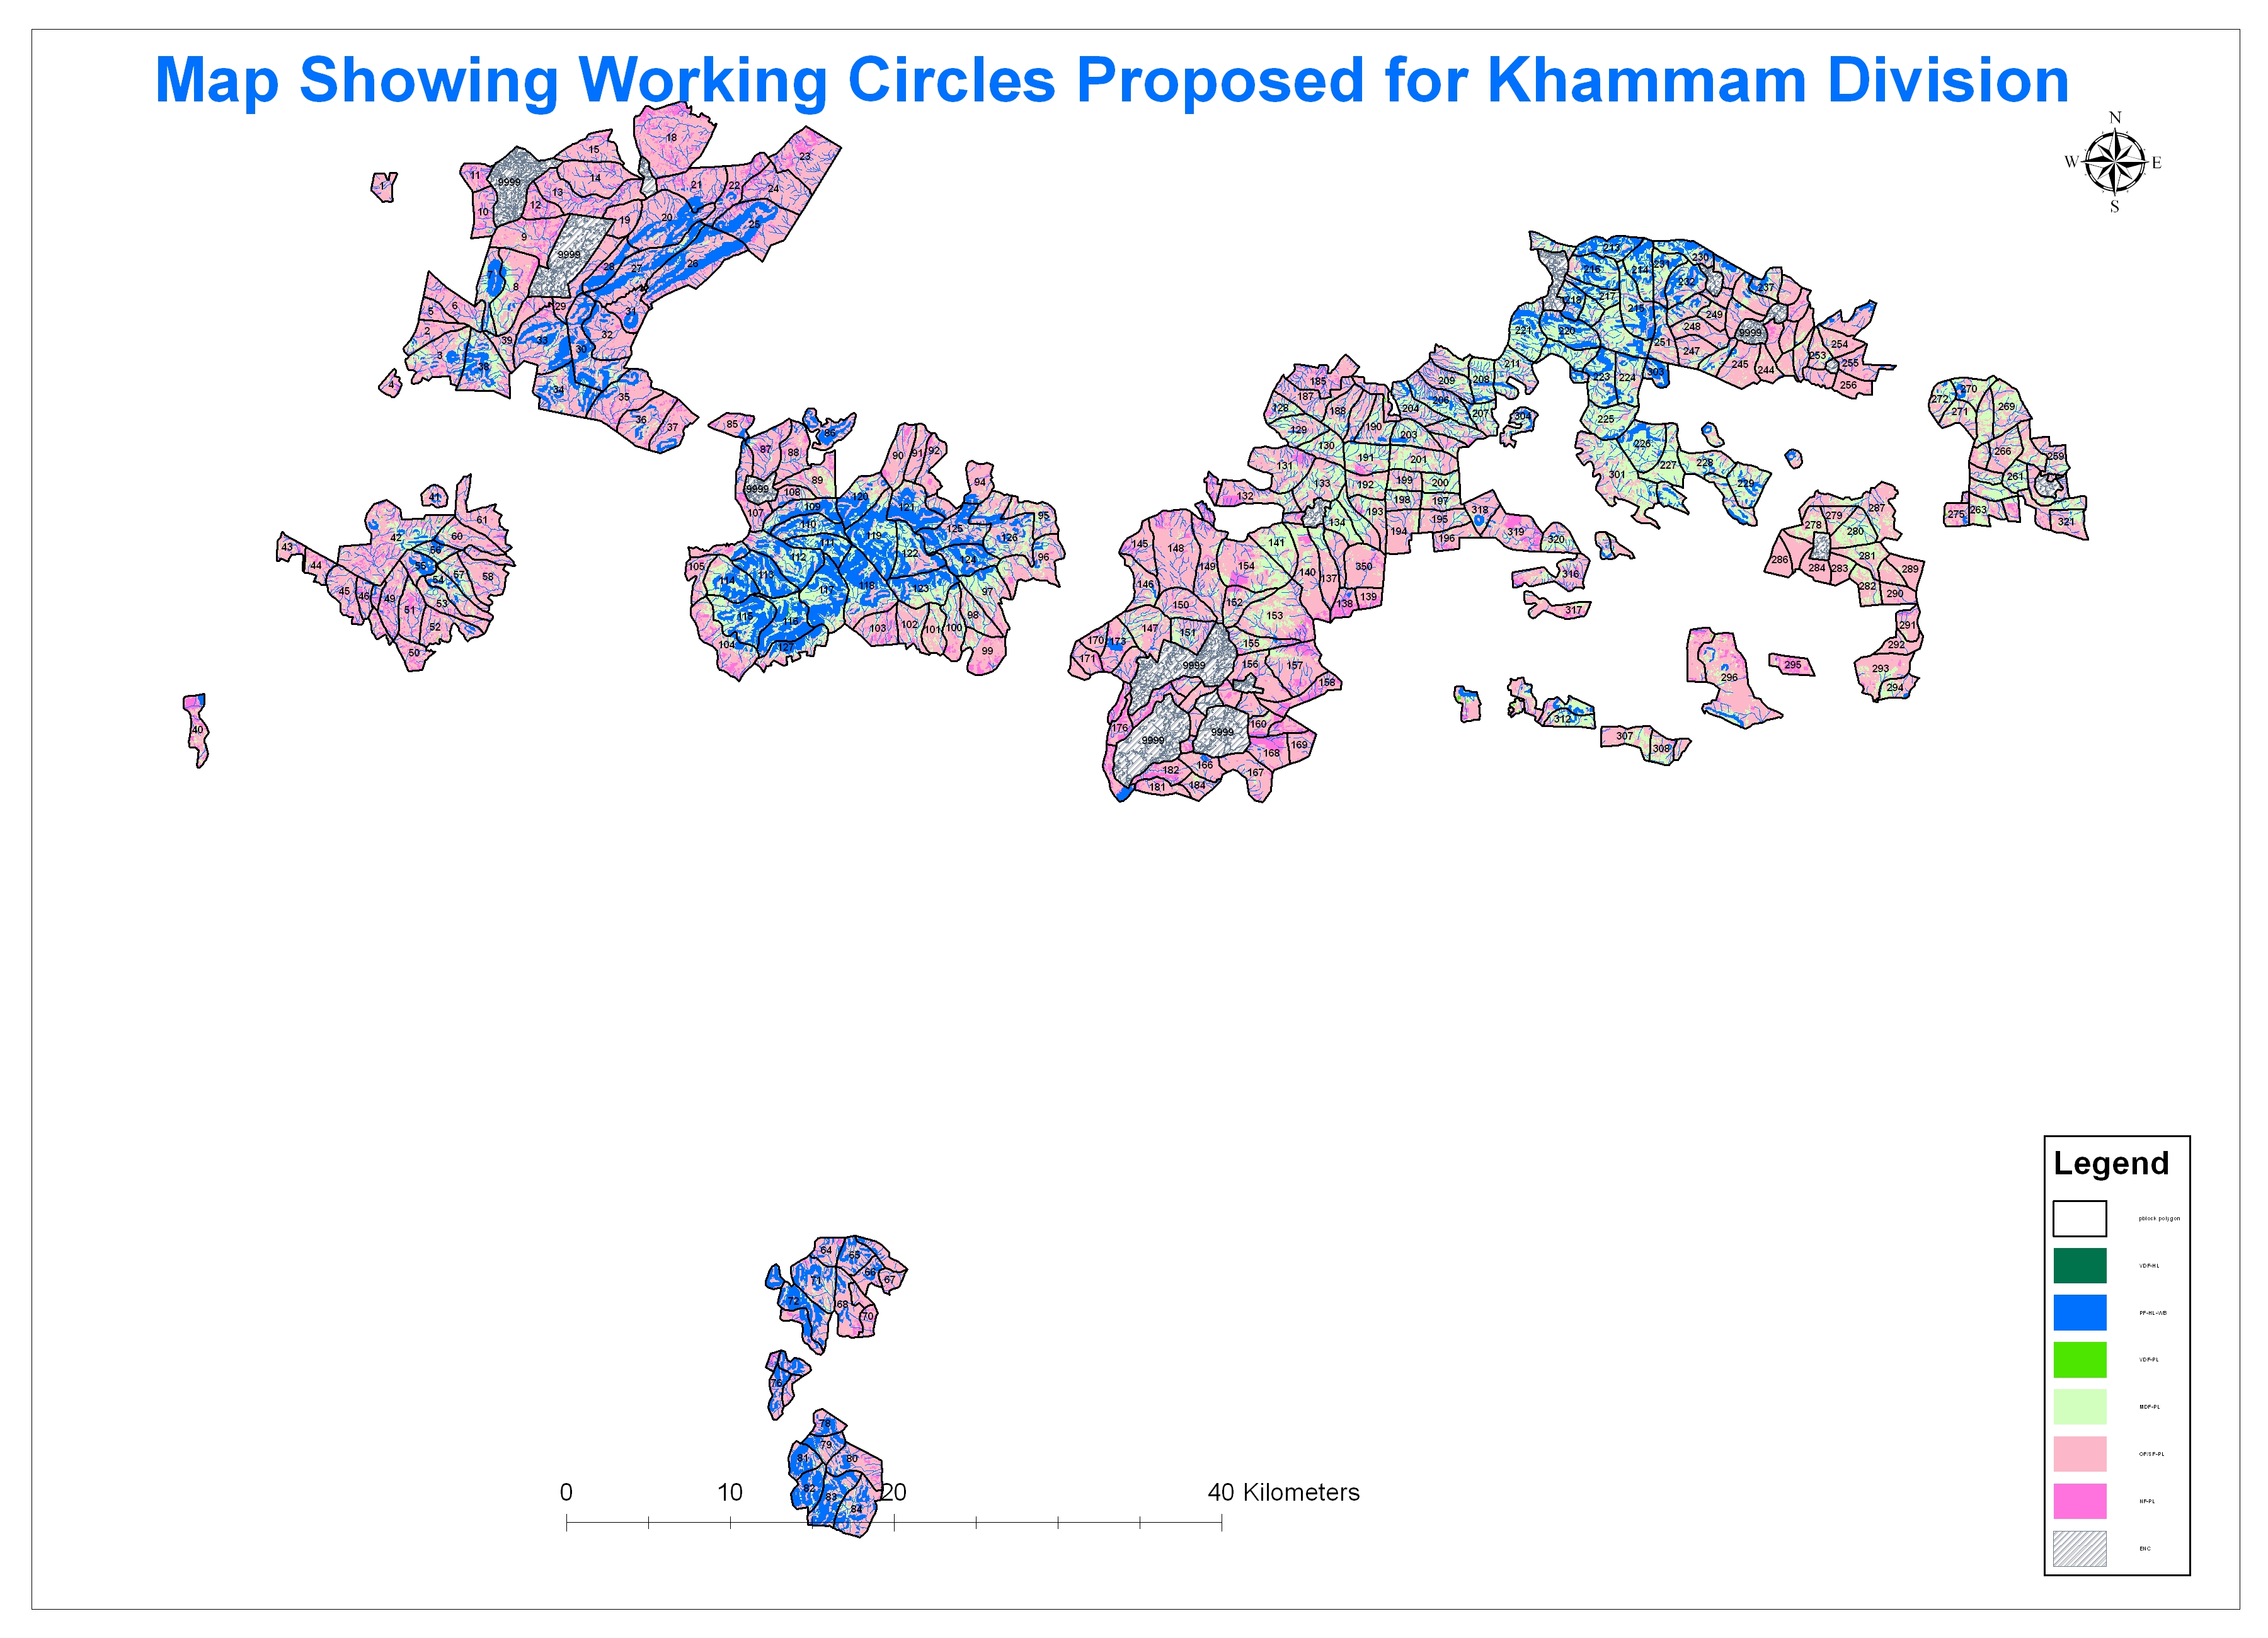
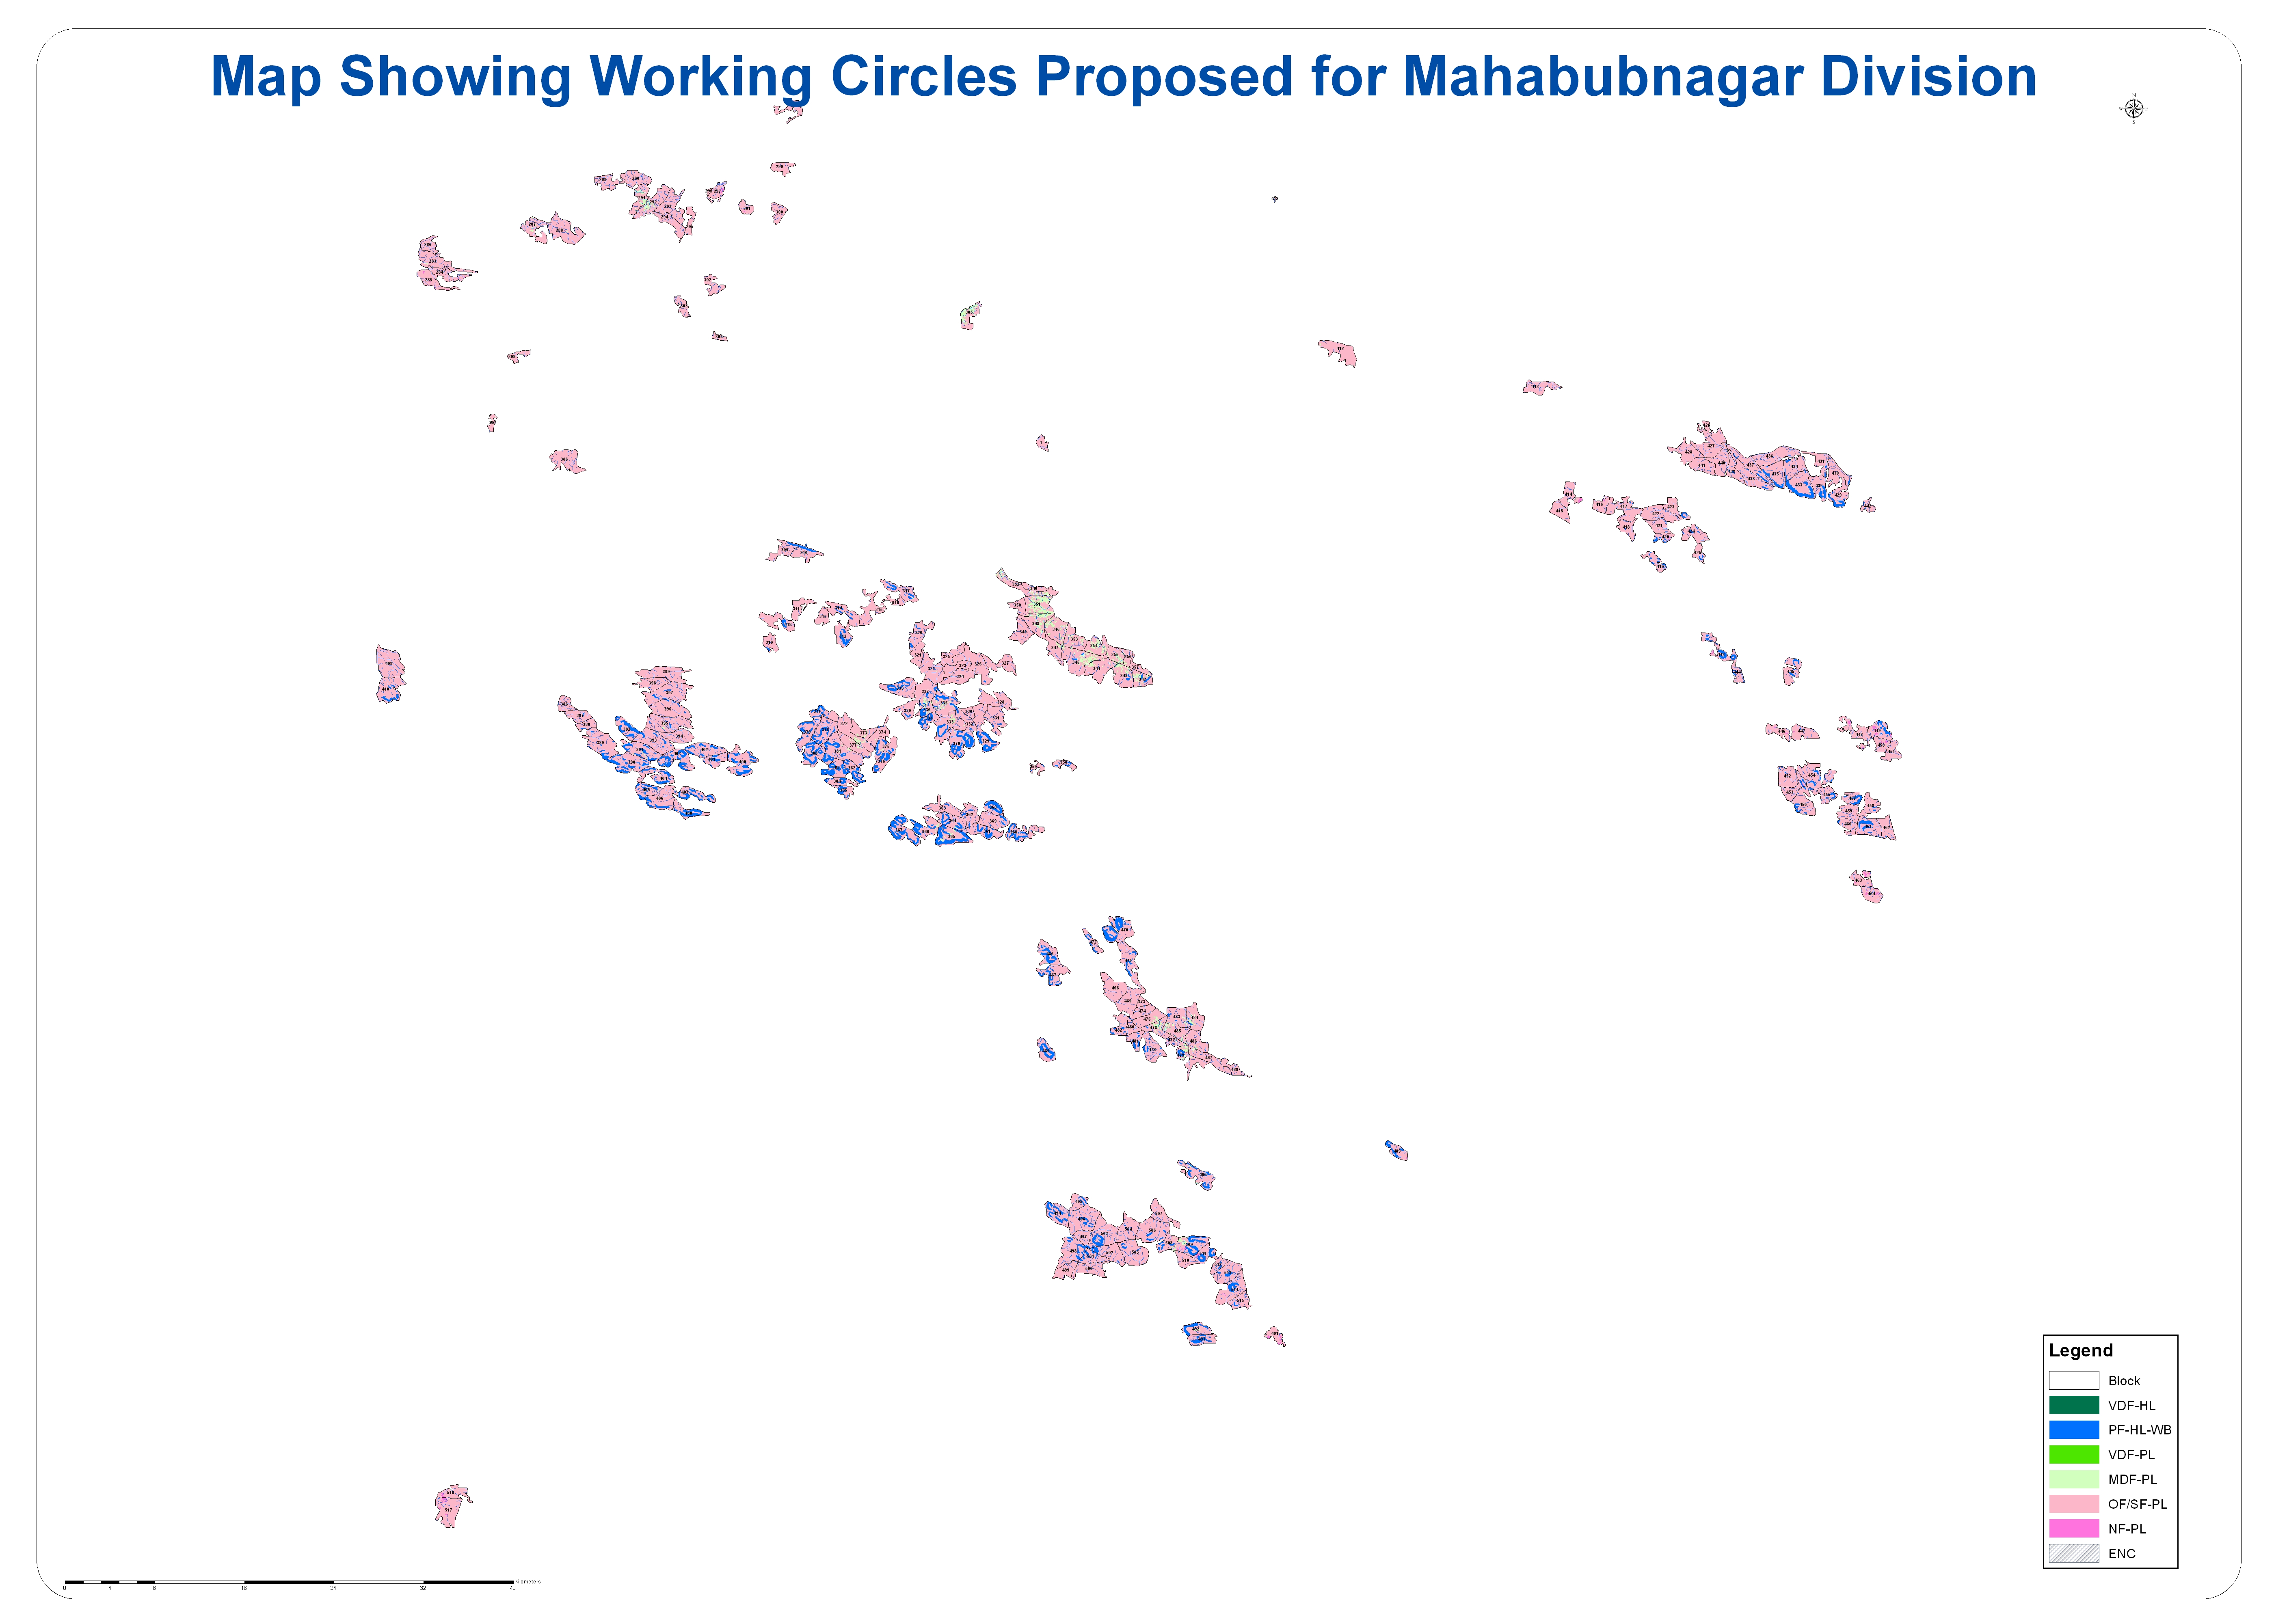
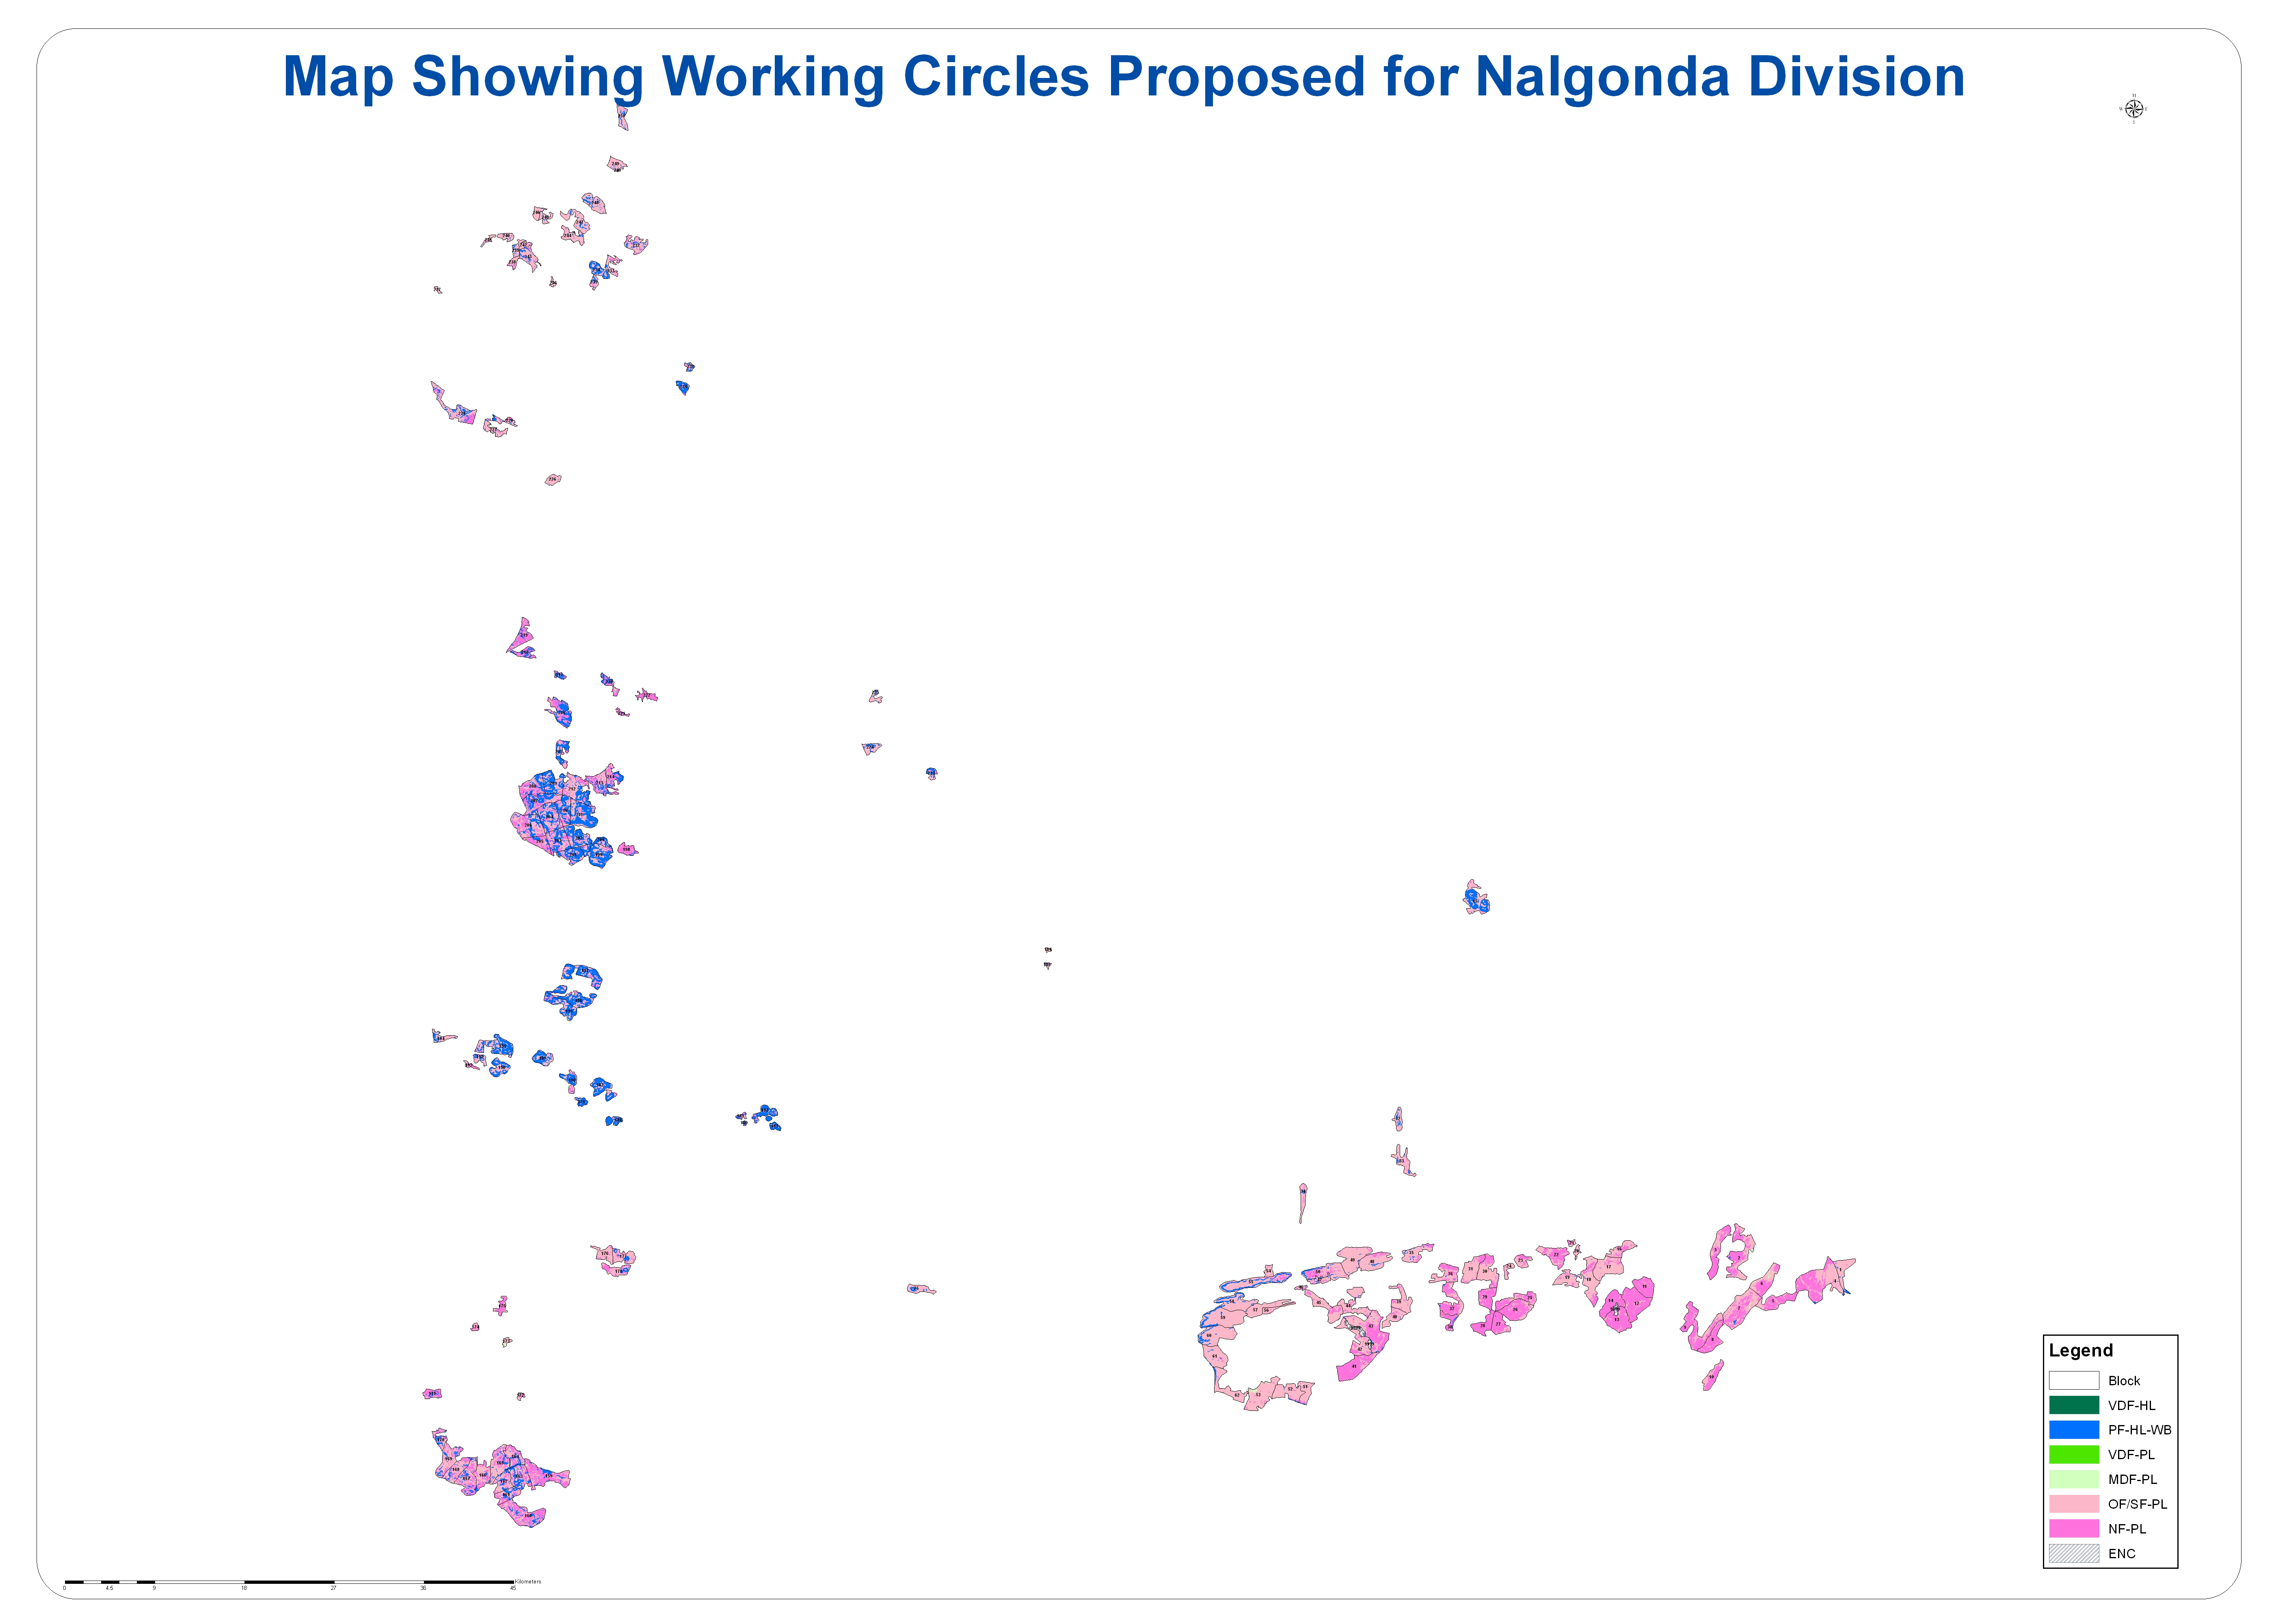
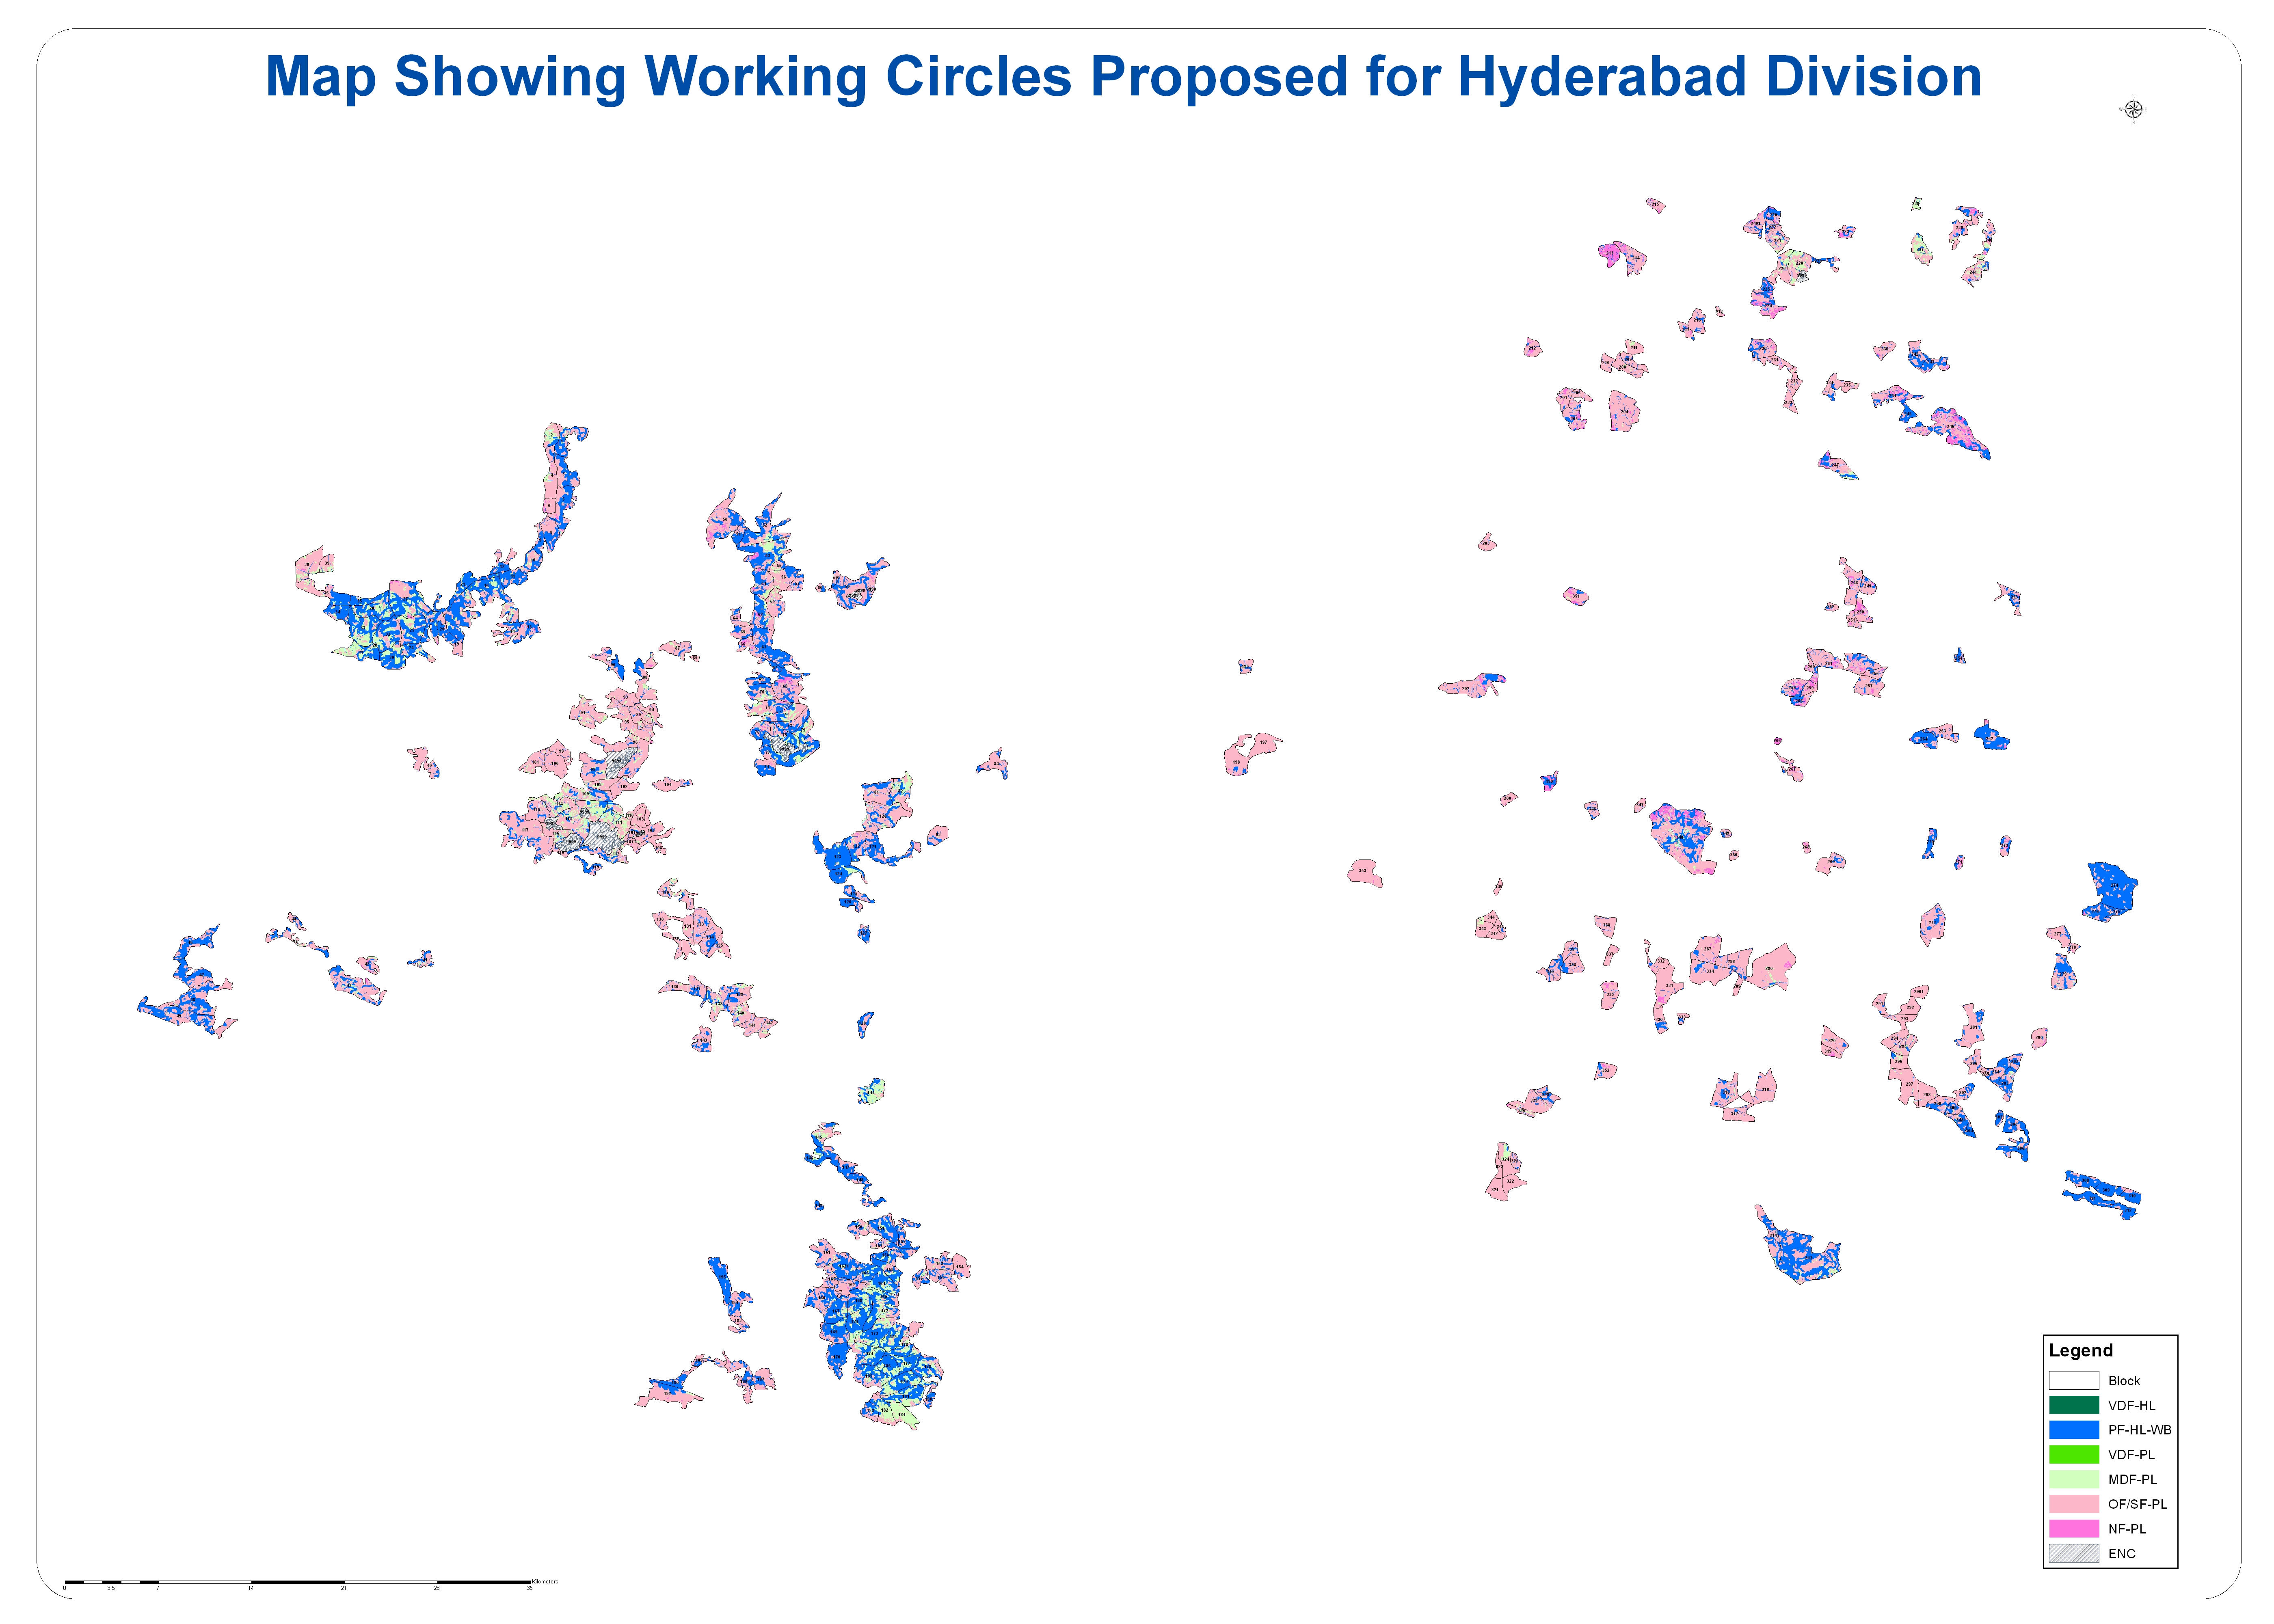
| Stratification for Creation of Working Circles | Click on Division Name for xls , COLOR for Color Map & BLACK for Black and White Map to View or Download | ||||||||||||||||
| Color Map | B&W Map | Beat Kml | Comp Kml | Beat Shape | Comp Shape | Division | VDF-HL | PF-HL/WB | VDF-PL | MDF-PL | OF/SF-PL | NF-PL | Total (Ha) | Note: | |||
| 1 | 1 | 1 | 1 | 1 | 1 | Mancheial | 731.07 | 14,776.39 | 3,455.08 | 49,992.40 | 35,510.37 | 7,072.50 | 111,537.81 | VDF-HL : Very Dense Forest in Hill Areas | |||
| PF-HF/WB : Other Than Very Dense Forest in Hill Areas or 20 Meters Buffer around Streams or Water Bodies | |||||||||||||||||
| 2 | 2 | 2 | 2 | 2 | 2 | Khammam | 5.91 | 27,760.30 | 46.12 | 25,035.98 | 69,302.49 | 7,215.66 | 129,366.46 | ||||
| VDF-PL : Very Dense Forest in Plain Areas | |||||||||||||||||
| 3 | 3 | 3 | 3 | 3 | 3 | Badrachalam South | 3,930.62 | 45,015.33 | 3,274.33 | 35,954.79 | 38,173.59 | 3,017.72 | 129,366.38 | MDF-PL : Moderate Dense Forest in Plain Areas | |||
| OF/SF-PL : Open/Scrub Forest in Plain Areas | |||||||||||||||||
| 4 | 4 | 4 | 4 | 4 | 4 | Palvoncha | 1,733.70 | 31,656.42 | 1,467.86 | 28,684.62 | 79,190.36 | 9,620.31 | 152,353.27 | NF-PL : Non Forest in Plain Areas | |||
| 5 | 5 | 5 | 5 | 5 | 5 | Adilabad | 1,637.93 | 66,755.41 | 2,015.79 | 50,827.73 | 54,335.03 | 14,323.27 | 189,895.16 | Conditions Applied | |||
| 6 | 6 | 6 | 6 | 6 | 6 | Bellampally | 6,822.49 | 51,763.10 | 7,058.29 | 50,828.58 | 25,554.36 | 10,452.66 | 152,479.48 | ||||
| 7 | 7 | 7 | 7 | 7 | 7 | Badrachalam North | 419.96 | 20,938.73 | 305.56 | 31,023.01 | 80,314.36 | 10,555.85 | 143,557.47 | 25 Divisions Added | |||
| 8 | 8 | 8 | 8 | 8 | 8 | Warangal North | 0.00 | 36,071.32 | 0.00 | 75,209.82 | 98,383.66 | 21,360.85 | 231,025.65 | ||||
| Prepared on Limited Inputs. | |||||||||||||||||
| 9 | 9 | 9 | 9 | 9 | 9 | Warangal South | 0.00 | 19,389.43 | 0.00 | 22,373.44 | 44,856.93 | 30,845.64 | 117,465.44 | Slope,Density , Streams/WaterBodies & Block Layers only | |||
| 10 | 10 | 10 | 10 | 10 | 10 | Mahabubnagar | 0.00 | 8,619.51 | 0.00 | 1,260.73 | 51,891.28 | 177.29 | 61,948.81 | ||||
| Important : If you Find entirely Different values in the Division Please inform to GIS Center for Modifications. Thank You. | |||||||||||||||||
| 11 | 11 | 11 | 11 | 11 | 11 | Achampet | 0.00 | 47,214.99 | 1.08 | 36,108.22 | 152,831.56 | 6,181.44 | 242,337.29 | ||||
| 12 | 12 | 12 | 12 | 12 | 12 | Karimnagar East | 0.00 | 15,083.40 | 0.00 | 58,553.87 | 60,934.61 | 4,109.80 | 138,681.68 | ||||
| Source | |||||||||||||||||
| 13 | 13 | 13 | 13 | 13 | 13 | Karimnagar West | 0.00 | 9,724.97 | 0.00 | 44,424.12 | 42,275.94 | 1,022.57 | 97,447.60 | Contours (Slope) is from TopoSheets | |||
| Vegetation Density (Class) is from Satellite Data of 2009 | |||||||||||||||||
| 14 | 14 | 14 | 14 | 14 | 14 | Kagaznagar | 3,500.97 | 9,102.45 | 11,536.01 | 32,827.24 | 21,624.28 | 10,738.08 | 89,329.03 | Compartments is from Division Data. | |||
| Streams/Water Bodies is from Toposheets | |||||||||||||||||
| 15 | 15 | 15 | 15 | 15 | 15 | Nalgonda | 0.00 | 7,846.98 | 0.00 | 98.04 | 22,722.05 | 13,532.98 | 44,200.05 | ||||
| 16 | 16 | 16 | 16 | 16 | 16 | Jannaram | 3,048.43 | 14,389.62 | 2,075.47 | 31,823.66 | 12,281.69 | 755.00 | 64,373.87 | For Download Keep Cursor on Required Link and Click Right Side Button From Mouse.From Popup select and Click " Save Target As / Save Link as " Command and Save in Local Directory. All Images are in JPG Format. If any assistance required feel free to contact Geomatics Center,Aranya Bhavan,APFD. (Extn : 653) | |||
| 17 | 17 | 17 | 17 | 17 | 17 | Nirmal | 257.93 | 18,671.69 | 258.89 | 52,513.92 | 25,264.41 | 5,550.02 | 102,516.86 | ||||
| 18 | 18 | 18 | 18 | 18 | 18 | Hyderabad | 0.00 | 23,653.33 | 0.00 | 6,367.01 | 43,893.34 | 1,974.21 | 75,887.89 | ||||
| 19 | 19 | 19 | 19 | 19 | 19 | Kamareddy | 0.00 | 14,457.34 | 0.00 | 25,275.06 | 52,222.28 | 6,174.35 | 98,129.03 | ||||
| If you have any Questions,Feel free to Contact | |||||||||||||||||
| 20 | 20 | 20 | 20 | 20 | 20 | Medak | 0.00 | 16,704.71 | 0.00 | 5,607.11 | 66,553.14 | 2,793.28 | 91,658.24 | Addl.PCCF(PF) | |||
| 21 | 21 | 21 | 21 | 21 | 21 | Nizamabad | 0.00 | 11,750.68 | 0.00 | 25,349.00 | 34,765.49 | 6,846.86 | 78,713.03 | ||||
| 22 | 22 | 22 | 22 | 22 | 22 | Kothagudem | 0.00 | 20,804.75 | 3.00 | 28,779.50 | 94,655.98 | 24,145.68 | 168,388.91 | GOOGLE EARTH | |||
| 23 | 23 | 23 | 23 | 23 | 23 | Warangal WLM | 0.00 | 2,457.76 | 0.00 | 20,669.88 | 28,359.66 | 2,368.30 | 53,855.60 | HELP | |||
| 24 | 24 | 24 | 24 | 24 | 24 | Palvoncha WLM | 33.19 | 9,742.33 | 72.81 | 18,530.36 | 35,397.72 | 4,862.06 | 68,638.47 | KML files can open on Google Earth | |||
| Symbols for Stock Mapping | |||||||||||||||||
| 25 | 25 | 25 | 25 | 25 | 25 | NagarjunaSagar | 0.00 | 21,175.47 | 0.00 | 496.45 | 44,793.65 | 13,032.87 | 79,498.44 | ||||
| Total (Ha) | 22,122.20 | 565,526.41 | 31,570.29 | 758,614.54 | 1,316,088.23 | 218,729.25 | 2,912,651.92 | ||||||||||
| ; | |||||||||||||||||